CASI
By Boston Cell Standards | Funded by The National Cancer Institute, National Institutes of Health | Terms & Privacy
The Magnani-Taylor editorial1 proposed a significant increase in immunohistochemistry (IHC) test quality assurance. Published endorsements of the editorial by the Consortium for Analytic Standardization in Immunohistochemistry (CASI) and its organizational membership (NordiQC, UKNEQAS-ICC/ISH, CBQA)2 as well as the leadership of the National Society for Histotechnology (NSH)3 show that the IHC Community recognizes the problem, agrees on the solution, and is ready for these changes. The editorials propose adopting the same quality systems that successfully standardize immunoassays.
How Do I Implement Analytic Standards in My IHC Lab?
A complete system for implementing analytic standards is now available. It includes IHC calibrators, IHC quantitative controls, and software for image analysis and SPC (Levey-Jennings graphing). IHC calibrators are for inter-laboratory standardization. IHC quantitative controls are for intra-laboratory standardization.
Align My Labs With Other Labs
Step 1: Identify your IHC LOD & dynamic range
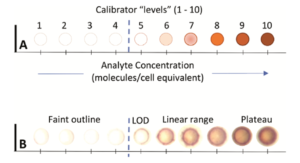
IHC calibrators provide up to 10 concentrations of the biomarker (e.g., HER2). The color intensity on the calibrators is a function of the biomarker concentration. You can use IHC calibrators to visually determine the limit of detection (LOD). The LOD is the lowest biomarker concentration that still produces a visible color. With image quantification, an exact LOD can be calculated. Each lab can compare its LOD with those of peer labs and published data. Once LODs can be measured for the same assay performed in many different laboratories, all laboratories can be harmonized to the agreed upon LOD. This harmonization is the stated purpose of CASI.
CASI has provided this figure, illustrating the method to measure the LOD using IHC Calibrators.
Include citation: SA Bogen, DJ Dabbs, KD Miller, S Nielsen, SC Parry, MJ Szabolcs, N t’Hart, CR Taylor, EE Torlakovic. A Consortium for Analytic Standardization in Immunohistochemistry. Arch. Pathol. Lab. Med. 2022. 147(5):584-590.
“When used in this way, calibrators provide a quantitative measurement of an IHC assay’s analytic sensitivity. Calibrators can serve as the link between the assay in your laboratory and the original clinical trial assay. Knowing the LOD will facilitate disseminating new assays in a consistent fashion and monitoring assay performance on each patient sample. Calibrators enable direct comparisons of IHC assay analytic performance.”

From: Hempenius, M.A., Høeg, H., Dabbs, D.J., van der Vegt, B., Sompuram, S.R. and ‘t Hart, N.A. (2024), Quantitative comparison of immunohistochemical HER2-low detection in an interlaboratory study. Histopathology. https://doi.org/10.1111/his.15273
From: A Consortium for Analytic Standardization in Immunohistochemistry
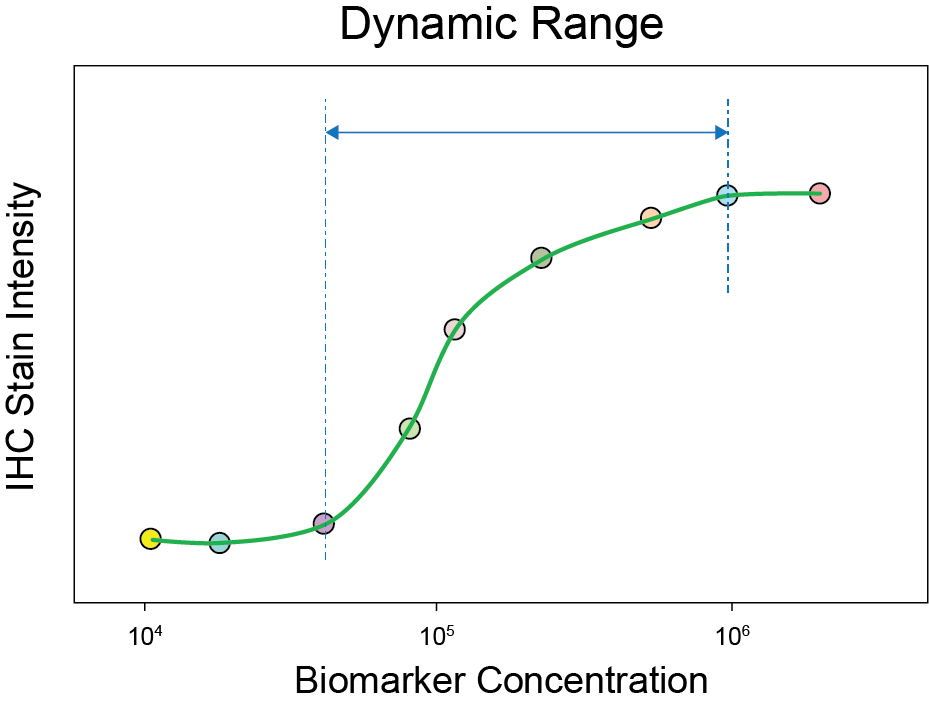
You can also use the calibrators to identify the assay’s dynamic range. Below is an illustration of the dynamic range of an IHC assay that was determined using IHC calibrators.
Schematic representation of an immunohistochemical assay with incorporation of the immunohistochemistry calibrators and dynamic range cell lines. The schematic relationship between the epitope concentration and staining intensity can be visualised as a sigmoid curve. The 10 individual calibrator beads are presented as circles. Below the x-axis four cell lines are presented with negative, low, middle and high positive staining. The LOD (lower limit of detection) is the first visible staining and determines the sensitivity of the assay. The dotted lines represents the area of the dynamic range of the assay.
Align My Lab With Itself
Step 2. Implement Statistical Process Control (“Levey-Jennings graphing”).
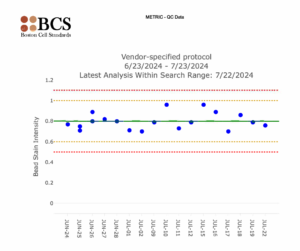
Statistical Process Control is a standard of laboratory practice in laboratory medicine. In laboratories, it usually takes the form of Levey-Jennings charts. It is named after Stanley Levey and E. R. Jennings, who suggested in 1950 that control charts could be used in the clinical laboratory. The first step is to select an IHC quantitative control with a biomarker concentration that falls within the dynamic range (from Step 1). This biomarker concentration offers the best sensitivity for daily IHC quality assurance.
The date of the control run is plotted on the x-axis. Stain intensity is plotted on the y-axis. The graphical data of control values over time monitor day-to-day consistency. Usually, the data will be consistent over time.
Lines run across the graph at the mean, as well as one and two standard deviations to either side of the mean. This makes it easy to see how far off the result was. The system performs the statistical analysis using Levey-Jennings charts.

Slowly progressing problem:
Sudden failure:
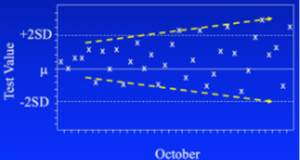
Random, repeating error:
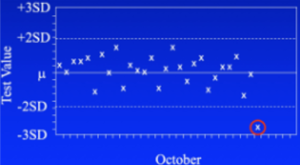
With statistical process control, you’re looking for 3 patterns. The first on the left above is called drift. Something is slowly changing in the instrument or reagents. The pattern offers clues as to the cause. In this instance, it could be a reagent is approaching its end of life. If it’s an instrument malfunction, it has to be something that’s slowly and progressively failing.
The second pattern (center above) is a sporadic outlier. A significant malfunction of some sort has happened requiring repeating the test. Examples include a pump malfunction, heater failure, drying of the reagent, or a failed dispense.
The third pattern (right above) is a worsening of precision, or reproducibility. It can happen in both directions, with higher and lower QC values as shown here, or only one. This might be caused if the pipetter is over and under-dispensing or is mis-aligned. It has a random nature, behaving in an unpredictable fashion.
From a previous study*, a Levey-Jennings showing the time period where a histotechnologist went on vacation and a replacement unknowingly made changes resulting in volume decreases in reagents.
Systemic issues can occur gradually, and are shown in a trend in the Levey-Jennings, or acutely, showing an immediate and then sustained change in the Levey-Jennings. Systemic issues will always appear at first like a random issue, but the identifiable trend in the Levey-Jennings alerts the lab to these systemic issues.
Examples of systemic issues are:
K Vani, SR Sompuram, SP Naber, JD Goldsmith, R Fulton, & SA Bogen. Levey-Jennings analysis uncovers unsuspected causes of immunohistochemistry stain variability. Appl. Immunohistochem. Mol. Morphol. 2016 24(10):688-694.
Summary
It is now possible to implement analytic standardization within your IHC lab using the same QA/QC approaches that have been used successfully for decades in other types of medical laboratories. IHC analytic standardization requires a complete system that includes IHC calibrators, IHC quantitative controls, and software for image analysis and SPC (Levey-Jennings graphing). These innovations will improve IHC lab testing accuracy and reproducibility.
For more information regarding the specific tools needed to achieve these QA/QC improvements click here.
Reference
By Boston Cell Standards | Funded by The National Cancer Institute, National Institutes of Health | Terms & Privacy